|
|
|
Denny Sullivan |
|
Telephone:
& also at |
| Economic Outlook - Budget 2015 | ||||||||
|
|
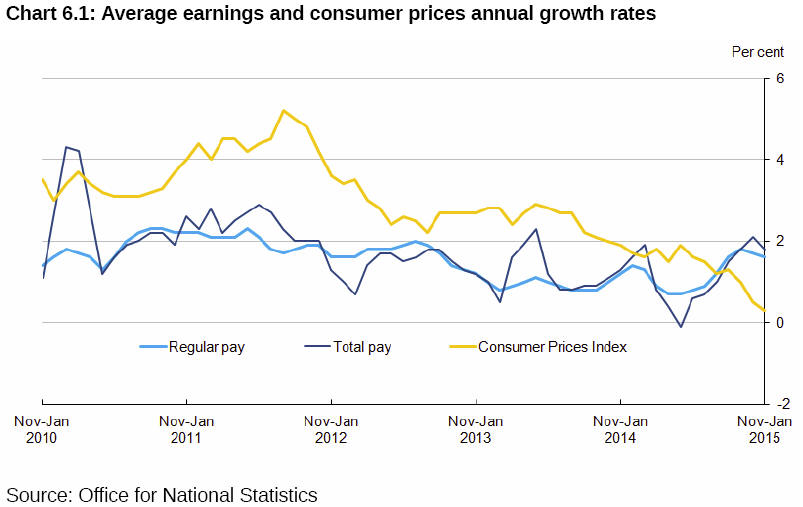
The combination of ultra-low inflation, partly driven by falling oil prices, and recent improvement in earnings has led to average earnings growing in real terms for the first time since the start of the recession. Since the last forecast in December 14, The OBR state there have been a number of significant developments with economic and fiscal implications, with further:
According to the OBR the outlook for the world economy and trade growth are gloomier than three months ago. Although taken together these appear to have had a relatively modest net effect on the economic forecast they report:
In almost every budget during this Parliament the scorecard of ‘giveaways’ and ‘takeaways’ broadly offset each other. The real action takes place in assumptions for public spending. The Coalition’s spending assumptions deliver a tighter squeeze on total spending through to 2018, but then loosen spending in 2019. The political fox Mr Osborne shot is that total spending should no longer reach its lowest share of GDP since before WWII. Although then there is an unrealistic ‘rollercoaster profile’ for spending on public services: a much sharper squeeze in 2016-18 than seen over the past five years followed by the biggest increase in real spending for a decade in the last year of the next Parliament 2019-20.
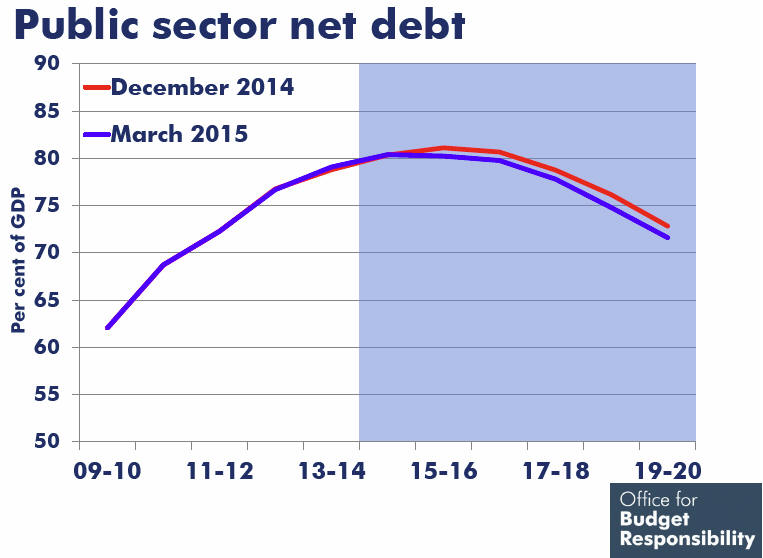
Sale of Northern Rock and Lloyds Bank assets helps reduce debt-to-GDP. Enabling Government to say the target of having national debt fall as a proportion of Gross Domestic Product at the end of this Parliament is met. Net debt is expected to fall by a tiny fraction between this year and next, rather than rising by 0.8% as shown in the OBR’s December forecast. Growth of UK economy Real GDP growth of 2.6% in 2014 as a whole was the most since before the recession in 2007, supported by a combination of investment and consumer spending. Falling oil prices have led to inflation falling to 0% and widely expected to lead to real household incomes rising strongly in 2015, underpinning further growth in consumer spending.
The starting point for the OBR forecast is a weaker picture than previously reported by the Office for National Statistics (ONS), which has revised down its measurement of growth from the first quarter of 2013 to the third quarter of 2014 from 5.1 to 4.5%. The broader picture of annual growth remains healthy:
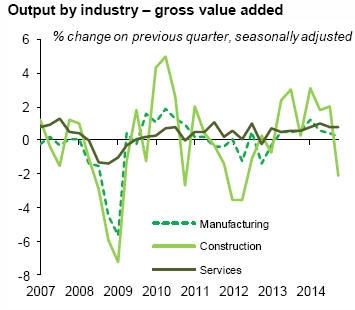
During the recession 2008/2009 GDP fell by 6.0%. A steady recovery over the rest of 2009 and 2010, gave way to weaker growth in 2011 and stagnation in 2012 with growth returning at the start of 2013. Growth from 2010 to 2014 has been driven by domestic demand: consumer spending was up by nearly 6%, government consumption rose by 4%, and investment increased by around 17%. While exports rose by 10%, the contribution to growth was offset almost entirely by a near 10% increase in imports.
The services sector – which dominates the UK economy, accounting for 80% of output – has grown significantly since 2010. As a whole, the sector has grown by 11% and is now 8% above its pre-recession peak in 2008. Until recently, a resurgent housing market and improved credit conditions and confidence have supported increases in consumer spending despite average earnings growth being lower than inflation. According to the ONS, real household disposable income per head is the same as 7 years ago. The OBR’s central GDP projection of 2.5% GDP growth for 2015 is somewhat weaker than the Bank of England’s at 2.9%, but they appear to agree that there is likely to be strong consumer spending growth in 2015 whereas it had been expected to slow. Productivity and potential output of economy
Nevertheless, although GDP is reported as 3.4% above the highest level seen before the recession, when adjusted for population growth, GDP is still 1.4% below its pre-recession peak, almost seven years on. One principal reason is the continuing weakness in labour productivity. GDP per head has been flat since 2007, historically annual productivity growth has been around 2%, the same rate as GDP per head - a measure of living standards. The recent period of productivity stagnation raises unanswered questions.
For the OBR, the growth of potential productivity remains below its historical average throughout their 5 year forecast reflecting slow normalisation over some years following the near collapse of the financial system. But they say since it is difficult to explain the abrupt fall and persistent weakness of productivity in recent years, it is also hard to judge when or if productivity growth will return to its historical average, which in turn affects the potential of the economy for growth. The OBR estimate a gradual strengthening of potential output growth over the next five years, but have a pessimistic estimate of spare capacity or gap between actual and potential output. The Bank of England’s Monetary Policy Committee view of ‘slack’ is currently in the region of ½% of GDP, while the OBR’s estimate of the output gap is narrower at 0.4%. Labour market The UK labour market has also continued to surprise economists in the last five years. Following a dip in 2011, UK employment has been growing strongly since the spring of 2013 and remains at a record high: 30.94 million people (73.3% of people aged from 16 to 64) were in employment at January 2015, 617,000 more than for a year earlier; 1.9 million more than May 2010. Most of this employment growth is attributable to more full-time workers: 481,000 more than last year. Extraordinary, since the economy has grown less in the last five years than the OBR thought it would.
There are 1.86 million unemployed people, 479,000 fewer than for a year earlier. Reported unemployment in June 2010 was 2.47 million people. On the other hand pay growth has remained muted, consistently lagging behind inflation growth, until recently. Average pay was 1.7% higher excluding bonuses in the three months to December 2014 compared to the year before. By comparison, CPI inflation over the same period averaged 0.9%.
Public finances Upon coming to power in May 2010 the Coalition made control of the public finances its raison d'être. Going further than Labour’s measures by announcing tax increases, in particular VAT, with cuts to social security and spending on public services. These ‘austerity’ measures were expected, by the end of this Parliament, to have debt falling as a % of GDP and reduce the deficit to 2% of GDP. In that respect the plan did not succeed since tax revenues fell consistently and considerably short of expectations, particularly for income tax, ground which the OBR consider cannot be recovered and will necessitate further substantial spending cuts in the next Parliament to balance the budget. Each of the main Westminster parties is committed to reducing the deficit following the largest peacetime economic shock in living memory.
The deficit may have since been halved, but public borrowing remains, pre-election, at £90 billion annually or 5% of national income (GDP) this year (2014-15), which the Coalition has reduced from its post-war peak of an annual deficit of £153 billion or 10.2% GDP in 2009-10.
At March 2015, national net debt of £1,479 billion (80.4% GDP) is much greater than predicted in June 2010 of £1,284bn around £200bn higher than originally hoped for, but importantly for Government finances the cost of servicing the national debt has shrunk over the last five years. Much lower interest rates than envisaged in 2010 have lightened the burden of deficit reduction. Net debt (PSND) was £956 billion (62% GDP) at the end of 2009/10 and at the time of the Coalition coming to power, the increase over the life of this Parliament is £523 billion or over 50%. Public spending In December the Government’s outline plan for total expenditure implied public spending would fall to 35% GDP in 2019-20. A loosening of spending in 2019 would take it to 36% of GDP then in kilter with current levels of tax revenue and government receipts, but possibly not with the historical average for spending that is in the region of 40% of GDP.
Real government consumption is estimated to have grown by 1.5% in 2014. Relative to the size of the economy, nominal government consumption is forecast to fall from 19.7% of GDP in 2014 to 16.1% of GDP by 2019. This is less of a fall than the OBR forecast in December, but would still leave government consumption as a share of GDP equal to its level in 1964.
The OBR point out that, apart from 2019, the main reasons for lower spending in this March 2015 forecast are lower inflation and interest rates, which reduce debt interest payments and welfare spending.
Interest rates Since December, interest rate expectations have fallen significantly. The first increase in Bank Rate is now expected in mid-2016 rather than late 2015. Bank Rate expectations are 0.5 percentage points lower than in December for the first quarter of 2020, only reaching 1.7% in five years’ time, whereas Bank Rate had been implied as 2% in 2019. New mortgage rates have fallen significantly since mid-2012, the OBR expect effective mortgage rates to fall further in the near term and then to rise only slightly over the next five years.
Housing market The Treasury report that there continue to be signs of normalisation in the housing market although house prices grew by nearly 10% in the year to December 2014 (compared to 5½% to December 13). The OBR expect house price growth to average 6% annually over the next five years. Oil prices
The price of Brent crude oil reached an all-time high above $145/barrel in July 2008. In January 2015 it fell to its lowest level in six years at $46. Oil is a key global commodity which gives an important indication in the absence of changes in supply about global demand. The OBR judges that the fall in oil prices reflects both lower-than-expected global demand and higher-than-expected global supply of oil.
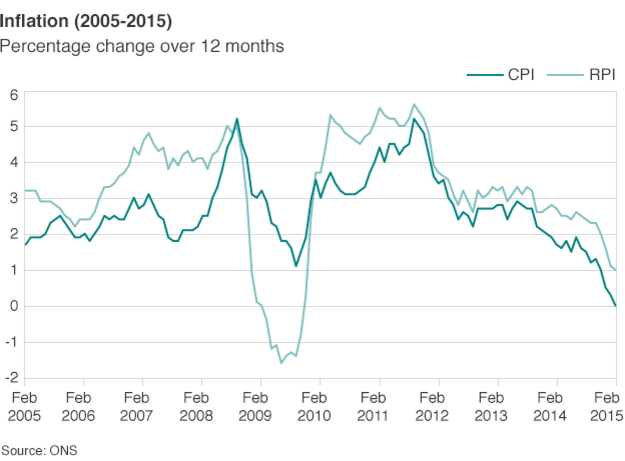
One consequence is that the OBR’s forecast for CPI inflation has been revised down significantly since December, primarily reflecting the implications of sterling oil prices.
Concerns about deflation affecting the Eurozone seem less relevant to the UK economy. While UK inflation, as measured by the CPI, has fallen from just under 2% in June 14 to 0% in January 15, inflation has not yet turned negative, although the Bank of England now expect it to do so in the first half of this year 2015.
Perhaps the main reason to be relaxed is that the current ultra-low level of inflation has a specific cause, the steep fall in the oil price, rather than reflecting more widespread declining prices across the economy as a whole Anthony Denny March 2015 |
|||||||