|
On
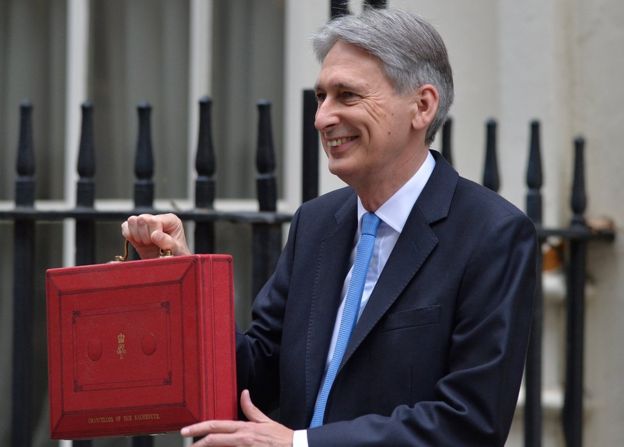
Wednesday 22nd November 2017 the Chancellor Philip Hammond presented to
Parliament the Conservative Government’s fourth Budget, his second and the
‘first Autumn Budget’. This is under a new Parliamentary schedule, intended
to end tax announcements being made twice each year. The idea is to announce
tax changes well in advance of the tax year.
The
Office for Budget Responsibility (OBR) also published their updated
forecast, which they have been doing since 2010.
GDP growth slightly subdued, but steady
In March this year, UK consumer confidence appeared un-dented by the EU
referendum result for Brexit, with UK economic growth during the second half
of 2016 continuing unabated, arising from the strongest annual expansion of
consumer spending since 2004.
This year, 2017, GDP growth has been slightly subdued, but steady, primarily
owing to a slower rate of growth in consumer spending.
In fairness, even though this may be described as a ‘noticeable slowdown’
from those higher growth rates seen in recent years, the latest quarterly
GDP growth in the third quarter of 2017 is similar to that reported for the
first two quarters of the year.
The cause may well be that, on average, real earnings have continued
to fall. Yet earnings are increasing above inflation for the lowest-paid
employees, who have benefited from the National Living Wage. The main
beneficiaries being part-time workers, in contrast to weaker earnings,
between 2016 and 2017, for workers on middle levels of pay.
The Treasury’s survey of forecasters indicates GDP growth for 2017 of around
1.6%. At the March 2017 Budget the OBR had forecast growth in 2017 of 2%,
now revised down by 0.5 percentage points. The OBR expect a steady fourth
quarter, reinforcing performance consistent with growth of 1.5% for 2017
as
a whole.
Last year, the OBR had expected growth to slow, mainly owing to higher
inflation and their continuing concerns over weaker business investment
which it assumed depressed future productivity growth.
Even so
growth of the economy has been slightly weaker this year than they
originally anticipated in March 2017, now closer to their muted Autumn 2016
predictions. The OBR believed then that there would be ‘significant’
downward pressure on growth in 2017 and 2018. The OBR's concerns revolved around
two main judgements which underpin their economic forecasting:
1.
Firstly, uncertainty regarding future trade and migration policies leading
businesses to defer investment, exacerbated by price-inflation squeezing
consumer spending, partially mitigated by stronger export trade.
2.
Secondly, that potential growth in productivity is weaker, owing to weaker
investment, while acknowledging that this link is not well understood.
As it has
transpired this year, weaker sterling appears to have had the predicted
effect of inflating import prices, in turn pushing up consumer price
inflation, which then has squeezed household incomes.
The
Sterling Exchange Rate Index (SERI) measuring sterling’s value against a
‘basket’ of currencies is just over 26% below its January 2007 peak level.
But on average the pound was up nearly 6% from November 2016 and the third
successive month the year on year increase has been positive. The value of
the pound against the dollar had fallen sharply since the EU Referendum,
from $1.48 on 23 June 2016 to around $1.35 at the start of December 2017.
At the
start of December, the Euro was valued at around €1.14 per £1, which
compares with a daily all-time low of €1.02 in December 2008 and a launch
rate of €1.48 in December 1998.
Weaker sterling has also helped export growth, although this is reported as
only partially offsetting the effect of unexpectedly strong import growth.
UK productivity
The OBR have now significantly revised their opinion about the prospects for
UK productivity, which changed markedly in the wake of the 2008/09 Crash,
leading to a revision of economic growth throughout their forecast.
Although the outcome has been that economic growth this year has not
diverged greatly from the OBR’s March forecast, the breakdown of the
relationship between employment and productivity has shown a much greater
divergence.
Over the last three quarters of 2017 employment has risen by nearly one
quarter of a million people at a rate that is twice as fast as expected, but
average hours worked per person in the UK have been close to flat rather
than falling as expected.
Similarly, just before the 2008/09 recession, GDP and GDP per head (in real,
inflation-adjusted, terms) peaked in 2008. During the recovery GDP surpassed
this level in mid-2013 and now (Autumn 2017) 9.7% above the pre-recession
peak. Yet, if you adjust for population growth the gain in GDP is much
lower, with GDP per head only 2.4% above its pre-recession level of a decade
earlier.
The pattern of unexpectedly strong employment growth and unexpectedly weak
productivity growth has been a consistent and constant feature of economic
forecasts since the Crash.
This inescapable fact has led the OBR to revise assumptions about the
potential size of the UK economy based on historic rates of potential
productivity growth.
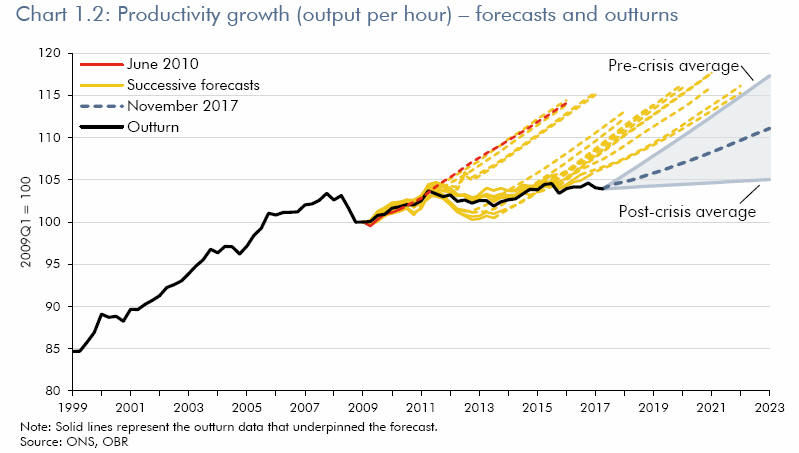
Productivity growth has been much weaker since the Crash than for decades
beforehand. Output per hour has risen by just 0.2% each year since 2008,
compared to an average of 2.1% a year over the preceding 35 years.
Any judgement about potential hours worked in an economy reflects judgements
about population size of those active and employed, and the number of hours
worked on average.
To the OBR it now seems sensible, some might say realistic, to take account
of weaker UK productivity. Review of this critical assumption has taken some
time in coming.
UK gross domestic product - outturn
Gross domestic product (GDP), the monetary value of all the finished goods
and services produced, has had unbroken growth for 19 consecutive quarters,
the latest revised official statistics from the ONS estimate growth to be
1.8% in 2016.
The
latest updated statistics for growth (or fall) in GDP reported by the ONS,
for the last decade are:
|
2007 |
2008 |
2009 |
2010 |
2011 |
2012 |
2013 |
2014 |
2015 |
|
2.4% |
-0.5% |
-4.2% |
1.7% |
1.5% |
1.5% |
2.1% |
3.1% |
2.3% |
Source ONS: IHYP November 2017
As an indicator of confidence and predictor of performance, the Purchasing
Managers’ Index was 54.5 this time last year. It has kept stable, above the
‘magic 50’ level, for fifteen consecutive months following the EU
referendum. It is now 53.8 (Dec’ 17), having previously shown the fastest
pace of growth in business activity for six months.
In 2016, the service sector accounted for 79% of economic output, the
production sector 14%, construction 6% and agriculture 1%. Growth in the
dominant services sector (retail, financial, leisure) accounts for 84% of
workforce jobs, but has slowed this year.
In contrast, manufacturing output has been growing at an average annual rate
of 2.2% in the past four quarters, seemingly benefiting from an increase in
export orders.
Recently, the Confederation of British Industry (CBI) survey suggests that
UK manufacturers are reporting the strongest order books since 1988.
Apparently net trade has contributed modestly to overall growth in the first
half of 2017, contrary to the OBR’s expectation. Exports have been boosted
by a strengthening global economy, and in particular from the Eurozone.
GDP by Expenditure: household consumption is the largest element of
expenditure across the economy, accounting for 63% of the total in 2016.
Government consumption accounted for 19% and investment 16%.
The Bank of
England believes Brexit-related uncertainty is weighing on investment. The
overall level of investment in the economy is only slightly higher (2%)
in
2017 compared with 2007, the pre-recession peak level.
In contrast with the UK’s latterly subdued economic growth, the world
economy has strengthened during 2017.
The IMF
noted, in its recent appraisal of prospects for future world economic
growth, that the Eurozone, which has struggled to establish a sustained
recovery since the global financial crisis has been on an upward trend,
with GDP 2.5% higher in Q3 2017 compared with a year before, and the
highest growth rate for a decade. Growth in the US has also picked up this
year.
The IMF has said that improved growth
of the world economy is “notable because it is broad-based”.
Forecast for world GDP growth
On 28 November the OECD raised its 2018 GDP growth forecast for the
UK to 1.2% from 1.0% in the previous September forecasts, (their 2017 UK
growth forecast is at 1.5%).
Inflation and monetary policy
Headline inflation has tipped just over 3%. Although, the CPI measure
averaged 2.6% in 2013 and 1.5% in 2014, it was very low for most of 2015, at
near zero, before picking up again. That historic fall in inflation was
largely owing to the fall in the oil price and lower food prices. These have
since increased.
The fall in the value of the pound since late 2015 and following the EU
referendum in June 2016 has caused higher import prices, which probably have
been passed onto consumers.
One of the key drivers of inflation is the price of food, around half of
food and drink consumed in the UK is imported.
Bank of England research suggests price pressures faced by producers have
eased in recent months. The Bank forecasts inflation to ease to around 2% to
2½% next year, relieving the squeeze on households’ finances.
The
Bank's MPC can look through the fact inflation is above 2%, if there is
the belief the situation is temporary. However, owing to the decade-long
stagnation in UK productivity, the most important factor governing the
growth potential of an economy, the MPC revised their view that this
factor is likely to return to the pre-crisis average of 2% per year.
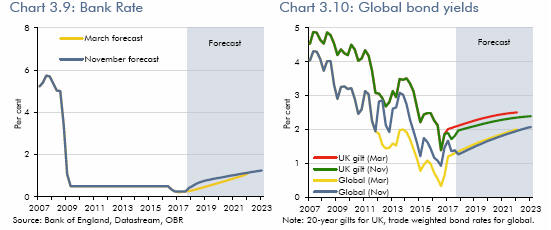
Higher inflation was the cue to raise
interest rates for the first time
since 2007. Reversing the previous policy decision to reduce rates following
the EU referendum which had held the Bank Rate at 0.5% for seven years prior
to August 2016.
Consumers and households have been somewhat squeezed by inflation, average
wage growth adjusted for inflation (July-September 2017) was 0.6% lower than
a year before. Remarkably though, wage growth remains weak despite
unemployment being at its lowest rate since 1975 and near-record UK
employment rates, confounding economists’ expectations.
Labour market
The UK labour market continues to surprise following the 2011 dip. From then
on, UK employment has grown relentlessly from 29 million; 32.06 million
people in the UK were recorded in work in the three months to October 2017,
just over 75% of people aged from 16 to 64 in the UK, an increase of over 3
million people in the workforce since 2011.
Public finances
Once
again, public finances have been performing much better than the OBR have
expected. The revised estimate of annual public sector borrowing for 2017/18
is £50 billion - previously forecast as £58 billion.
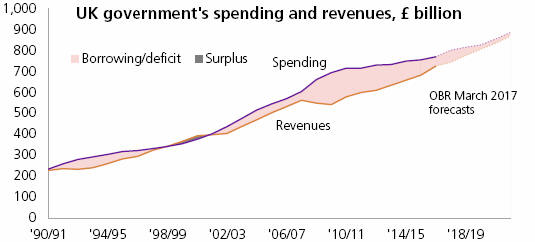
Government spending in excess of tax and other revenues is commonly known as
‘the deficit’. Government borrowing for the deficit has fallen considerably
since the massive borrowing during the financial crisis, from a peak of £153
billion in 2009/10 to £46 billion in 2016/17. As an indicator of size this
is just over 2% of GDP and similar in scale to the level of borrowing before
the 2007-2008 financial crisis - the historical average from the mid-1970s
to 2007/8 is 2.6%; post-war average to date is 2.4%.
The principal reason the OBR have revised their expectation of future growth
is owing to a downward revision of potential productivity growth. If UK
productivity does not improve then pressure may mount on future Government
borrowing.
The OBR say Government remains on course to hit the looser targets set for
borrowing and debt in 2020-21, but with less room for manoeuvre. The
longer-term objective of “balancing the Budget”, which was the ambition of
the 2010 Coalition Government to achieve in 2015/16, now looks more
challenging.
But, they are on their way to getting there. Government borrowed less in the
first half of 2017/18 than during the first half of 2016/17.
Public sector net debt
In March the OBR expected public sector net debt (PSND), the total stock of
Government debt, to peak at nearly 89% of GDP this year, 2017-18. It is
still considered that debt will peak during the fiscal year, but at the
slightly lower figure of 87% GDP.
As a comparison, the 2010 emergency budget predicted the gargantuan figure
of 70% GDP, and Alistair Darling, Chancellor in the last Labour government,
had planned for it to rise to no more than 75% GDP, from the pre-crisis base
of 35% GDP.
Alternatively, another comparison might be the recorded public-sector net
debt after World War 2 (1946/47), which was then a truly whopping 259% of
GDP!
The
Treasury's lucky black cat, Gladstone, the photogenic resident Chief Mouser
of HM Treasury at Whitehall.
Anthony Denny
December 2017
|